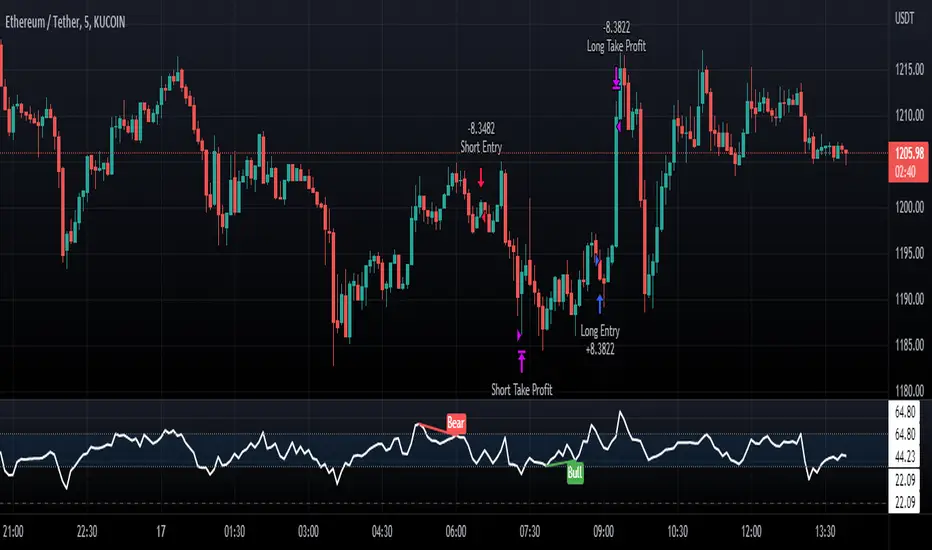
Normalized CCI Divergence StrategyStrategy Overview:
This script takes the Commodity Channel Index and normalizes the equation to be read easier by the user. Bullish, Bearish, Hidden Bullish, and Hidden Bearish divergences are identified and displayed in the underlay. Hidden Bullish and Hidden Bearish are turned off by default, but can be turned on in the user settings. The strategy itself signals long or short based on the appearance of these divergences in addition to previous CCI values being above or below a threshold. *Shorter timeframes such as 5M are recommended.* Take profit, stop loss, and trailing percentages are also included, found at the bottom of the Input tab under “TT and TTP” as well as “Stop Loss”. Make sure to understand the TP/SL ratio that you desire before use, as the desired hit rate/profitability percentage will be affected accordingly. This strategy does NOT guarantee future returns. Apply caution in trading regardless of discretionary or algorithmic. Understand the concepts of risk/reward and the intricacies of each strategy choice before utilizing them in your personal trading.
Profitview Settings
If you wish to utilize Profitview’s automation system, find the included “Profitview Settings” under the Input tab of the strategy settings menu. If not, skip this section entirely as it can be left blank. Options will be “OPEN LONG TITLE”, “OPEN SHORT TITLE”, “CLOSE LONG TITLE”, and “CLOSE SHORT TITLE”. If you wished to trade SOL, for example, you would put “SOL LONG”, “SOL SHORT”, “SOL CLOSE LONG”, and “SOL CLOSE SHORT” in these areas. Within your Profitview extension, ensure that your Alerts all match these titles. To set an alert for use with Profitview, go to the “Alerts” tab in TradingView, then create an alert. Make sure that your desired asset and timeframe are currently displayed on your screen when creating the alert. Under the “Condition” option of the alert, select the strategy, then select the expiration time. If using TradingView Premium, this can be open-ended. Otherwise, select your desired expiration time and date. This can be updated whenever desired to ensure the strategy does not expire. Under “Alert actions”, nothing necessarily needs to be selected unless so desired. Leave the “Alert name” option empty. For the “Message”, delete the generated message and replace it with {{strategy.order.alert_message}} and nothing else.
Cerca negli script per "take profit"
Three Bars Play Strategy [JoseMetal]============
ENGLISH
============
- Description:
This strategy is based on two simple candlestick patterns (you can pick between 2 variants) with an extra option to require trigger candles to be opposite to the closing one (explained below).
There are several customizable settings such as take profit, stop loss and break even (all based on ATR).
You can customize starting and ending date for the testings.
Other options such as allow switch position if strategy SHORTs when you are LONG and vice versa.
There's an additional optional EMA filter.
- LONG / SHORT ENTRY:
Original pattern: for LONG, current candle must close ABOVE the HIGH of previous candle and the candle 3 positions back, opposite conditions for SHORT.
Variant pattern: for LONG, the current candle must close ABOVE the HIGH of the previous candle and the candle before that one too, opposite conditions for SHORT.
Optional: require the trigger candles to be opposite, ex: for LONG you need the previous candles to be RED (bearish).
Optional: EMA filter, price must be ABOVE for LONGs, below for SHORTs.
- EXIT CONDITION:
Stop Loss or Take Profit, based on ATR.
- Visual:
The script prints the Take Profit as a GREEN line, Stop Loss as a RED line and entry price with a WHITE line.
If enabled, the Break Even required price is BLUE, and the new Stop Loss level (for break even or protecting profit) is AQUA.
- Recommendations:
This strategy is great on DAILY on most assets, including crypto, forex and gold.
12H seems to work in most cases, lower timeframes are worse.
- Customization:
You can customize indicator settings (ATR, EMA...).
Stop Loss and Take Profit ATR multipliers are also customizable.
The break even is optional, required level and break even levels (also based on ATR) are custom too.
Almost everything is customizable, for colors and plotting styles check the "Style" tab.
Enjoy!
============
ESPAÑOL
============
- Descripción:
Ésta estrategia se basa en dos patrones simples de velas (puedes elegir entre 2 variantes) con una opción extra para requerir que las velas de activación sean opuestas a la de cierre (se explica más adelante).
Hay varios ajustes personalizables como el take profit, el stop loss y el break even (todos basados en el ATR).
Puedes personalizar la fecha de inicio y finalización de las pruebas.
Otras opciones como permitir el cambio de posición si la estrategia cambie a SHORT cuando está LONG y viceversa.
Hay un filtro de EMA opcional adicional.
- ENTRADA LARGA / CORTA:
Patrón original: para LONG, la vela actual debe cerrar POR ENCIMA del ALTO de la vela anterior y de la vela 3 posiciones atrás, condiciones opuestas para SHORT.
Patrón variante: para LONG, la vela actual debe cerrar POR ENCIMA del ALTO de la vela anterior y la vela anterior a esa también, condiciones opuestas para SHORT.
Opcional: requiere que las velas de activación sean opuestas, por ejemplo: para LONG requiere que las velas anteriores sean ROJAS (bajistas).
Opcional: fltro EMA, el precio debe estar POR ENCIMA para los LONGs, por debajo para los SHORTs.
- CONDICIÓN DE SALIDA:
Stop Loss o Take Profit, basado en el ATR.
- Visual:
El script dibuja el Take Profit como una línea VERDE, el Stop Loss como una línea ROJA y el precio de entrada con una línea BLANCA.
Si está habilitado, el precio de break even requerido es AZUL, y el nuevo nivel de Stop Loss (para el break even o asegurar ganancias) es CELESTE.
- Recomendaciones:
Ésta estrategia es estupenda en DIARIO en la mayoría de los activos, incluyendo criptos, fórex y oro.
En 12H parece funcionar en la mayoría de los casos, las temporalidades inferiores son peores.
- Personalización:
Puedes personalizar la configuración de los indicadores (ATR, EMA...).
Los multiplicadores de Stop Loss y Take Profit ATR también son personalizables.
El break even es opcional, el nivel requerido y los niveles de break even (también basados en ATR) son personalizables también.
Casi todo es personalizable, para los colores y estilos de trazado compruebe la pestaña "Estilo".
¡Que lo disfrutes!

Double SuperTrend Strategy [JoseMetal]============
ENGLISH
============
- Description:
This is a simple strategy using 2 SuperTrends, a larger one for entries and smaller for Stop Loss, Take Profit is calculated via risk reward custom setting.
The strategy has several customizable options, which allows you to refine the strategy for your asset and timeframe.
You can customize settings for both SuperTrends, as well as the risk to reward ratio, starting date, ending date and more.
- LONG / SHORT ENTRY:
Both SuperTrends agree on the trend direction, both green = bullish = LONG, both red = bearish = SHORT.
- EXIT CONDITION:
Stop Loss or Take profit, however, there's an option (activated by default) to change position if entry conditions reverse.
- Visual:
Both SuperTrends are plotted.
The script prints the Take Profit as a green line, Stop Loss as a red line and entry price with a white line.
- Recommendations:
Depending on the asset, the strategy works from 1H to daily, feel free to test it on your favorite asset.
The strategy settings are good for crypto by default.
- Customization:
As you can see, almost everything is customizable, for colors and plotting styles check the "Style" tab.
Enjoy!
============
ESPAÑOL
============
- Descripción:
Esta es una estrategia sencilla que utiliza 2 SuperTrends, uno mayor para las entradas y otro menor para el Stop Loss, el Take Profit se calcula a través de la configuración personalizada de riesgo-beneficio.
La estrategia tiene varias opciones personalizables, lo que le permite refinar la estrategia para tu activo y marco de tiempo.
Puedes personalizar los ajustes para ambos SuperTrends, así como la relación riesgo-beneficio, la fecha de inicio, la fecha de finalización y más.
- ENTRADA EN LARGO/CORTO:
Ambos SuperTrends coinciden en la dirección de la tendencia, ambos verdes = alcista = LONG, ambos rojos = bajista = SHORT.
- CONDICIÓN DE SALIDA:
Stop Loss o Take profit, sin embargo, hay una opción (activada por defecto) para cambiar de posición si las condiciones de entrada se invierten.
- Visual:
Ambos SuperTrends son dibujados.
El script dibuja el Take Profit como una línea verde, el Stop Loss como una línea roja y el precio de entrada con una línea blanca.
- Recomendaciones:
Dependiendo del activo, la estrategia funciona de 1H a diario, siéntete libre de probarlo en tu activo favorito.
La configuración de la estrategia es buena para criptos por defecto.
- Personalización:
Como puedes ver, casi todo es personalizable, para colores y estilos de trazado revisa la pestaña "Estilo".
¡Que lo disfrutes!

SuperTrend Multi Time Frame Long and Short Trading Strategy
Hello All
This is non-repainting Supertrend Multi Time Frame script, I got so many request on Supertrend with Multi Time Frame. This is for all of them ..I am making it open for all so you can change its coding according to your need.
How the Basic Indicator works
SuperTrend is one of the most common ATR based trailing stop indicators.
In this version you can change the ATR calculation method from the settings. Default method is RMA.
The indicator is easy to use and gives an accurate reading about an ongoing trend. It is constructed with two parameters, namely period and multiplier. The default values used while constructing a Supertrend indicator are 10 for average true range or trading period and three for its multiplier.
The average true range (ATR) plays an important role in 'Supertrend' as the indicator uses ATR to calculate its value. The ATR indicator signals the degree of price volatility .
The buy and sell signals are generated when the indicator starts plotting either on top of the closing price or below the closing price. A buy signal is generated when the ‘Supertrend’ closes above the price and a sell signal is generated when it closes below the closing price.
It also suggests that the trend is shifting from descending mode to ascending mode. Contrary to this, when a ‘Supertrend’ closes above the price, it generates a sell signal as the colour of the indicator changes into red.
A ‘Supertrend’ indicator can be used on spot, futures, options or forex, or even crypto markets and also on daily, weekly and hourly charts as well, but generally, it fails in a sideways-moving market.
How the Strategy works
This is developed based on SuperTrend.
Use two time frame for confirm all entry signals.
Two time frame SuperTrend works as Trailing stop for both long and short positions.
More securely execute orders, because it is wait until confine two time frames(example : daily and 30min)
Each time frame developed as customisable for user to any timeframe.
User can choose trading position side from Long, Short, and Both.
Custom Stop Loss level, user can enter Stop Loss percentage based on timeframe using.
Multiple Take Profit levels with customisable TP price percentage and position size.
Back-testing with custom time frame.
This strategy is develop for specially for automation purpose.
The strategy includes:
Entry for Long and Short.
Take Profit.
Stop Loss.
Trailing Stop Loss.
Position Size.
Exit Signal.
Risk Management Feature.
Backtesting.
Trading Alerts.
Use the strategy with alerts
This strategy is alert-ready. All you have to do is:
Go on a pair you would like to trade
Create an alert
Select the strategy as a Trigger
Wait for new orders to be sent to you
This is develop for specially for automating trading on any exchange, if you need to get that automating service for this strategy or any Tradingview strategy or indicator please contact me I am have 8 year experience on that field.
I hope you enjoy it!
Thanks,
Ranga

RSI Buy & Sell Trading ScriptThis is my first attempt at a trading script using the RSI indicator for Buy & Sell signals (so please be nice but would appreciate any constructive comments).
Starting with $100 initial capital and using 10% per trade
You can select which month the backtesting starts
There is also a monthly table (sorry can’t remember who I got this from) that shows the total monthly profits, but you’ll need to turn it on by going into settings, Properties and in the Recalculate section tick the “On every tick” box
It should do the following:
Open Buy order if the RSI > 68 and the current Moving Average is greater than the previous Moving average
• TP1 = 50% of Order at 0.4%
• TP2 = 50% of order at 0.8%
• SL = 2% below entry
• Close Buy order if the RSI < 30
Open Sell order if the RSI < 28 and the current Moving Average is less than the previous Moving average
• TP1 = 50% of Order at 0.4%
• TP2 = 50% of order at 0.8%
• SL = 2% above entry
• Close Buy order if the RSI < 60
I would like to build on this if you have any ideas/ code that could help like the following:
• Move the SL to break even when it hits TP1
• Move the SL to TP1 when TP2 hits
• Moving take profit code so I can let the some of the trade stay in play (activate if it hits 1% profit and close trade if price retracts 0.5%)

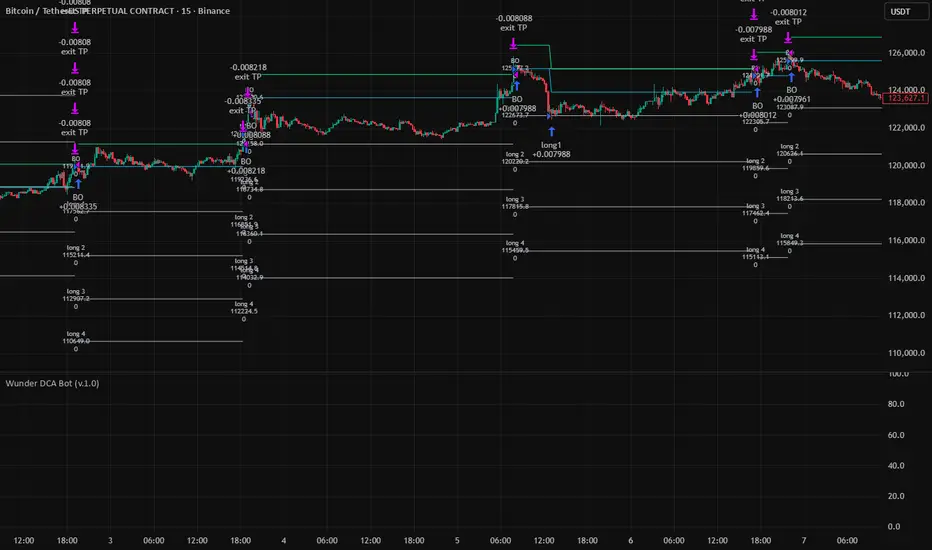
Wunder DCA BotThe bot is based on the DCA system.
1. DCA is the investment method in which you buy a certain portion of the asset after the determined price deviation.
2. For entry, we evaluate the maximum and minimum levels for a given period that you can adjust in the script. The bot enters when price rebound from the specified levels.
3. For the exit, the bot will use the take profit percentage that you will specify in settings.
It is also possible to choose how the take profit is calculated either from the average entry price or from the entry order (first order).
4. DCA uses the following settings:
- Base order Volume: Volume of your first order on entry signal
- Subsequent orders volume: The volume of all subsequent orders except the first
- DCA orders count: This parameter will determine how many entries your overall strategy will have. For example: If you will put 3, that will mean that including your initial position you will have 2 additional orders.
- DCA order price deviation:
This is the value in % which determines the deviation of the additional entries from the entry price. Example: If you go long and the price of the asset is 100$ and you put an order price deviation of 1% that will mean that the first additional entry will occur when the price will drop by 1%, and the second entry will be triggered when the overall price will drop by 2% (as the interval between the first and the second additional entry will be 1%).
- DCA Order Volume Multiplier:
This parameter will determine the amount that you put into each additional position. If this parameter is equal to 1 that means that each additional entry will be equal to the initial amount. The extra volume will be added to your position from the second DCA entry. Example: Your initial position was 10$ and your Volume Multiplier is set to 2. When you reach your 1st DCA target your additional order will have the same volume of 10$. When you reach your 2nd DCA target your additional order will be 20$ (previous position volume * multiplier). Your 3rd DCA target will place the order of 40$.
- DCA order price Deviation Multiplier:
This value will increase the price deviation between each additional entry. It is calculated as the price deviation multiplied by the deviation multiplier. For example: if you enter long at the price 100$ and have a price deviation of 1% with the price deviation multiplier of 2 that will mean that the first additional entry will occur when the price will drop to 99$ however the second will occur when the price will go to 97$. The third additional position will be entered at 94$
5. For full automation of the bot, you should set your comments to the input in the bot settings in the "LONG" and "SHORT" fields. You also need to create an alert signal and set a Webhook to send signals.
IMPORTANT!!!
1. Position calculation should take into account several factors: your deposit, leverage, the number of DCA orders, the distance to the last DCA order;
2. When choosing leverage, it is important to correctly calculate the possible drawdown. If you set a high leverage value, then liquidation awaits and the bot will not be able to take profits and will exit the position ahead of time;
3. The size of the position must be determined in accordance with all risks and take into account the size of your deposit;
4. This DCA Bot is able to earn consistently with the correct calculated money management.
Coral Trend Pullback Strategy (TradeIQ)Description:
Strategy is taken from the TradeIQ YouTube video called "I Finally Found 80% Win Rate Trading Strategy For Crypto".
Check out the full video for further details/clarification on strategy entry/exit conditions.
The default settings are exactly as TradeIQ described in his video.
However I found some better results by some tweaking settings, increasing R:R ratio and by turning off confirmation indicators.
This would suggest that perhaps the current confirmation indicators are not the best options. I'm happy to try add some other optional confirmation indicators if they look to be more effective.
Recommended timeframe: 1H
Strategy incorporates the following features:
Risk management:
Configurable X% loss per stop loss
Configurable R:R ratio
Trade entry:
Based on strategy conditions below
Trade exit:
Based on strategy conditions below
Backtesting:
Configurable backtesting range by date
Trade drawings:
Each entry condition indicator can be turned on and off
TP/SL boxes drawn for all trades. Can be turned on and off
Trade exit information labels. Can be turned on and off
NOTE: Trade drawings will only be applicable when using overlay strategies
Alerting:
Alerts on LONG and SHORT trade entries
Debugging:
Includes section with useful debugging techniques
Strategy conditions
Trade entry:
LONG
C1: Coral Trend is bullish
C2: At least 1 candle where low is above Coral Trend since last cross above Coral Trend
C3: Pullback happens and price closes below Coral Trend
C4: Coral Trend colour remains bullish for duration of pullback
C5: After valid pullback, price then closes above Coral Trend
C6: Optional confirmation indicators (choose either C6.1 or C6.2 or NONE):
C6.1: ADX and DI (Single indicator)
C6.1.1: Green line is above red line
C6.1.2: Blue line > 20
C6.1.3: Blue trending up over last 1 candle
C6.2: Absolute Strengeh Histogram + HawkEye Volume Indicator (Two indicators combined)
C6.2.1: Absolute Strengeh Histogram colour is blue
C6.2.2: HawkEye Volume Indicator colour is green
SHORT
C1: Coral Trend is bearish
C2: At least 1 candle where high is below Coral Trend since last cross below Coral Trend
C3: Pullback happens and price closes above Coral Trend
C4: Coral Trend colour remains bearish for duration of pullback
C5: After valid pullback, price then closes below Coral Trend
C6: Optional confirmation indicators (choose either C6.1 or C6.2 or NONE):
C6.1: ADX and DI (Single indicator)
C6.1.1: Red line is above green line
C6.1.2: Blue line > 20
C6.1.3: Blue trending up over last 1 candle
C6.2: Absolute Strengeh Histogram + HawkEye Volume Indicator (Two indicators combined)
C6.2.1: Absolute Strengeh Histogram colour is red
C6.2.2: HawkEye Volume Indicator colour is red
NOTE: All the optional confirmation indicators cannot be overlayed with Coral Trend so feel free to add each separately to the chart for visual purposes
Trade exit:
Stop Loss: Calculated by recent swing low over previous X candles (configurable with "Local High/Low Lookback")
Take Profit: Calculated from R:R multiplier * Stop Loss size
Credits
Strategy origin: TradeIQ's YouTube video called "I Finally Found 80% Win Rate Trading Strategy For Crypto"
It combines the following indicators for trade entry conditions:
Coral Trend Indicator by @LazyBear (Main indicator)
Absolute Strength Histogram | jh by @jiehonglim (Optional confirmation indicator)
Indicator: HawkEye Volume Indicator by @LazyBear (Optional confirmation indicator)
ADX and DI by @BeikabuOyaji (Optional confirmation indicator)

AlgoTrade DCA Bot Backtester█ OVERVIEW
This script can be used to backtest DCA Bots. It draws inspiration from 3Commas and has most settings that are available on 3Commas. It contains a few popular DCA Bot Presets that are well known in the community for you to test out! Preset used here: Kirigakure V4
█ FEATURES
DCA Preset (Custom, Standard TA,Urma Lite V3,Kirigakure V1,Kirigakure V3,Kirigakure V4)
Order Size Type (Fixed/% of equity to simulate compounding)
Base Order Size
Safety Order Size
Max Safety Trades Count
Price Deviation to open safety order %
Safety Order Volume Scale
Safety Order Step Scale
Take Profit %
Use ADR (Average Daily Range) as Take Profit
ADR length (if ADR as take profit is enabled)
Take Profit Type (% from total volume / % from base order)
Trailing Take Profit
Stop Loss
Deal Start Condition (Start ASAP) ▶ More Deal Starting Conditions will be added in the future
Bot Direction (Long / Short)
Start Time ▶ 1999-01-01 (Use this to always backtest the entire history)
End Time
This strategy also allows you to plot the Average Price and Take Profit of each trade, so it's easier to follow the trade and understand what's happening.
█ HOW TO USE
1. Select a DCA Preset and change the initial capital to the exact amount that is required (seen in the error message on top of the table). When using a Preset the following settings will be locked, meaning if you change them in the script's settings it won't have any effect:
Base Order Size
Safety Order Size
Max Safety Trades Count
Price Deviation to open safety order %
Safety Order Volume Scale
Safety Order Step Scale
Use ADR (Average Daily Range) as Take Profit
1.1 When using Presets you can choose the Order Size Type of Fixed or % of equity which simulates compounding
1.2 Choose a Direction and a Start and End Time
2. To backtest customized settings choose the preset "Custom"
2.1 All other settings are now "unlocked" and can be used
█ LIMITATIONS
Whenever a DCA preset is changed the initial_capital needs to be changed to the exact amount the settings require. If the initial_capital is not the same there will be an error of top of the table. To fix this error navigate to the Script's Settings and Properties and change the initial_capital to the same amount that is stated in the error.
DCA Bots with a high number of safety orders, e.g. 100, can run into an error that says "Maximum number of orders (9000) reached". If this error happens change the backtesting time to a shorter timeframe.
Using % of equity simulates compounding but is unrealistic because you cannot re-invest every single dollar
█ THANKS
This script in insipred by rouxam's "Backtesting 3commas DCA Bot v2" script

Risk Management Strategy TemplateThis strategy is intended to be used as a base template for building new strategies.
It incorporates the following features:
Risk management:
Configurable X% loss per stop loss
Configurable R:R ratio
Trade entry:
Calculated position size based on risk tolerance
Trade exit:
Stop Loss currently configurable ATR multiplier but can be replaced based on strategy
Take Profit calculated from Stop Loss using R:R ratio
Backtesting:
Configurable backtesting range by date
Trade drawings:
TP/SL boxes drawn for all trades. Can be turned on and off
Trade exit information labels. Can be turned on and off
NOTE: Trade drawings will only be applicable when using overlay strategies
Debugging:
Includes section with useful debugging techniques
Strategy conditions
Trade entry:
LONG
C1: Price is above EMA line
C2: RSI is crossing out of oversold area
SHORT
C1: Price is below EMA line
C2: RSI is crossing out of overbought area
Trade exit:
Stop Loss: Stop Loss ATR multiplier is hit
Take Profit: R:R multiplier * Stop Loss is hit
The idea is to use RSI to catch pullbacks within the main trend.
Note that this strategy is intended to be a simple base strategy for building upon. It was not designed to be traded in its current form.

J2S Backtest: Steven Primo`s Big Trend StrategyIs it possible to benefit from big trend moves? In this study I present you a strategy that aims to capture big trend moves.
Created by trader Steven Primo, The Big Trend strategy is advocates and shared through his YouTube channel without restrictions.
Note:
This is not an investment recommendation. The purpose of this study is only to share knowledge with the community on TradingView.
What is the purpose of the strategy?
The strategy focuses on capturing the movement of trends, providing an entry signal for both LONG and SHORT positions.
To which time-frame of a chart is it applicable to?
According to the author, it is applicable to any chart in different markets.
What about risk management?
The author does not establish a risk management model for strategy. This is left to the definition of each trader.
How are the trends identified in this strategy?
A 20-periods Bollinger Bands with 0.382 deviation should be plotted on the chart. Prices above the upper band indicate an uptrend, on the other hand, prices below the lower band indicate an downtrend. Finally, prices between the two bands indicate sideways trend.
How to identify a signal for LONG entry?
The signal is given after five consecutive closes above the upper Bollinger band. After that, you must enter the trade after the first trade occurs above the high of the signal bar.
How to identify a signal for SHORT entry?
The signal is given after five consecutive closes below the lower Bollinger band. After that, you must enter the trade after the first trade occurs below the low of the signal bar.
Tips and tricks
In my backtest, I tried to prove the strategy from a position trading perspective, so I proposed use fixed stop-loss and take-profits. The stop-loss is defined as being low of the first bar that generated the movement until the signal bar. The value range from the stop-loss to the signal bar is used in determining the profit target. Given any trade, position closing will be triggered when the bar trading limit is reached.
Backtest features
Backtest parameters are fully customizable, for instance: number of bars inside a trend indicating trend maturity for entry, bar limit for trading entry (after a buy or sell signals). Also, the user chooses to validate only LONG or SHORT entries, or both. It is also possible to determine the specific time period for running the backtests.
Final message
In my tests, I noticed excellent results for other crypto pairs, for example: ETH/USDT, BNB/USDT, FIL/USDT, GALA/USDT and ILV/USDT. Of course, no one strategy works perfectly for every asset, crypto, and bond out there. That's why we should explore each trading model and carry out our backtests. Please, feel free to provide me with any improvement suggestions for the backtest script. Bear in mind, feel free to use the ideas in my script in your studies.

Statistical Correlation Algorithm - The Quant ScienceStatistical Correlation Algorithm - The Quant Science™ is a quantitative trading algorithm.
ALGORITHM DESCRIPTION
This algorithm analyses the correlation ratios between two assets. The main asset (on the chart), and the secondary asset (set by the user). Then apply the long or short trading strategy.
The algorithm divides trading work into three parts:
1. Correlation analysis
2. Long or short entry
3. Closing trades
Inside the strategy: the algorithm analyses the percentage change yields from a previous session, of the secondary asset. If the variation meets the set condition then it will open a long or short position, on the primary asset. The open position is closed after 'x' number of sessions. Stop loss and take profit can be added to the trade exit parameters.
Logic: analyses the correlation between two assets and looks for a statistical advantage within the correlation.
INDICATOR DESCRIPTION
The algorithm includes a quantitative indicator. This indicator is used for correlation analysis and offers a quick reading of the quantitative data. The blue area shows the correlation ratio values. The yellow histograms show the percentage change in the yields of the main asset. Purple histograms show the percentage change in secondary asset yields.
GENERAL FEATURES
Multi time-frame: the user can set any time-frame for the secondary asset.
Multi asset: the user analyses the conditions on a second asset.
Multi-strategy: the algorithm can apply either the long strategy or the short strategy.
Built-in alerts: the algorithm contains alerts that can be customized from the user interface.
Integrated indicator: the quantity indicator is included.
Backtesting included: automatic backtesting of the strategy is generated based on the values set.
Auto-trading compliant: functions for auto trading are included.
USER INTERFACE SETTINGS
Through the intuitive user interface, you can manage all the parameters of this algorithm without any programming experience. The user interface is extremely descriptive and contains all the information needed to understand the logic of the algorithm and to configure it correctly.
1. Date range: through this function you can adjust the analysis and working period of the algorithm.
2. Asset: through this function you can adjust the secondary asset and its time-frame. You can enter any type of asset, even indices and economic indicators.
3. Asset details: this function is used to adjust the percentage change to be analyzed on the secondary asset. The analysis and input conditions are also chosen.
4. Active long or short strategy: this function is used to set the type of strategy to be used, long or short.
5. Setting algo trading alert: with this function, users can manage alerts for their web-hook.
6. Exit&Money management: with this function the user can adjust the exit periods of each trade and activate or deactivate any stop losses and take profits.
7. Data Value Analysis: this function is used to adjust the parameters for the quantity indicator.

Strategy Backtesting Template [MYN]A few people have been asking me to share my backtesting template. Currently I use this as my starting point for validating existing strategies and developing new ones.
Features:
Trading Date Range
Trade Direction
4 progressive take profits with target percents and percentage of position to take profit on (Thanks adolgo)
Variable percentage Stop Loss
Automatic ProfitView Alert Syntax builder for Longs and Shorts
ADX checkbox to automatically add conditional logic to your strategy

Inverse MACD + DMI Scalping with Volatility Stop (By Coinrule)This script is focused on shorting during downtrends and utilises two strength based indicators to provide confluence that the start of a short-term downtrend has occurred - catching the opportunity as soon as possible.
This script can work well on coins you are planning to hodl for long-term and works especially well whilst using an automated bot that can execute your trades for you. It allows you to hedge your investment by allocating a % of your coins to trade with, whilst not risking your entire holding. This mitigates unrealised losses from hodling as it provides additional cash from the profits made. You can then choose to hodl this cash, or use it to reinvest when the market reaches attractive buying levels.
Alternatively, you can use this when trading contracts on futures markets where there is no need to already own the underlying asset prior to shorting it.
ENTRY
The trading system uses the Momentum Average Convergence Divergence (MACD) indicator and the Directional Movement Index (DMI) indicator to confirm when the best time is for selling. Combining these two indicators prevents trading during uptrends and reduces the likelihood of getting stuck in a market with low volatility.
The MACD is a trend following momentum indicator and provides identification of short-term trend direction. In this variation it utilises the 12-period as the fast and 26-period as the slow length EMAs, with signal smoothing set at 9.
The DMI indicates what way price is trending and compares prior lows and highs with two lines drawn between each - the positive directional movement line (+DI) and the negative directional movement line (-DI). The trend can be interpreted by comparing the two lines and what line is greater. When the negative DMI is greater than the positive DMI, there are more chances that the asset is trading in a sustained downtrend, and vice versa.
The system will enter trades when two conditions are met:
1) The MACD histogram turns bearish.
2) When the negative DMI is greater than the positive DMI.
EXIT
The strategy comes with a fixed take profit combined with a volatility stop, which acts as a trailing stop to adapt to the trend's strength. Depending on your long-term confidence in the asset, you can edit the fixed take profit to be more conservative or aggressive.
The position is closed when:
Take-Profit Exit: +8% price decrease from entry price.
OR
Stop-Loss Exit: Price crosses above the volatility stop.
In general, this approach suits medium to long term strategies. The backtesting for this strategy begins on 1 April 2022 to 18 July 2022 in order to demonstrate its results in a bear market. Back testing it further from the beginning of 2022 onwards further also produces good returns.
Pairs that produce very strong results include SOLUSDT on the 45m timeframe, MATICUSDT on the 2h timeframe, and AVAUSDT on the 1h timeframe. Generally, the back testing suggests that it works best on the 45m/1h timeframe across most pairs.
A trading fee of 0.1% is also taken into account and is aligned to the base fee applied on Binance.

Joker Trailing TP BotTrailing Take Profit is used by the traders to increase their gains when the prices moves in a favorable direction. Let’s have a look at what is Trailing Take Profit and how it works.
What Is a Trailing Take Profit?
Trailing Take Profit is a term largely used in crypto, whereas you may encounter the term Trailing Stop in traditional trading describing almost the same thing, So what’s the difference between Trailing Take Profit and Trailing Stop? Trailing Stop is a type of Stop Loss automatically moving in the same direction as the asset’s price. Trailing Take Profit is nothing else than Trailing Stop activated after initial Take Profit is reached.
The main difference between these two is that Trailing Take Profit takes the profit in any case (altough it might be later annihilated by Trailing Stop). Thus, Trailing Take Profit reduces the risks that might’ve occurred using Trailing Stop alone. Trailing Take Profit is bound to the maximum of Take Profit price instead of just a price increase/decrease.
As you might notice, the terms Trailing Take Profit and Stop Loss are quite similar. To avoid confusion, in this article we will be talking about Trailing Take Profit as defined above.
Trailing Take Profit only moves in one direction. It is designed to lock in profit and limit losses. The trailing profit only moves up (in case of a long strategy) once the price has surpassed previous high and a new high has been established. If the trailing take profit moves up, it cannot move back down, thus securing the profit and preventing losses.
Trailing Take Profit allows the trade to remain open and continue to profit as long as the price is moving in the investor’s favor. If the price changes direction and the change surpasses the previously set percentage the order will be closed.
How Does it Work?
For example if you buy BTC at the price of 10000, if you set a Take Profit at 11000 and a Trailing Take Profit at 5% :
If the price goes up to 10500, nothing happens because the Take Profit at 11000 has not been reached.
Then if the BTC price goes up top 11000, a Stop Order at 10450 will be set.
Then if the BTC price goes down to 10500, the Stop Order stays at 104500.
Then if the BTC price goes up to 12000, the Stop Order moves to 11400.
Then if the BTC price goes down to 11000, the Stop Order at 11400 is executed.
You see that without Trailing Take Profit, the buy order would have been sold at 11000. Thus, a trader would miss an earning opportunity at 11400.

Dual Fibonacci Zone & Ranged Vol DCA Strategy - R3c0nTraderWhat does this do?
This is for educational purposes and allows one to backtest two Fibonacci Zones simultaneously. This also includes an option for Ranged Volume as a parameter.
Pre-requisites:
First off, this is a Long only strategy as I wrote it with DCA in mind. It cannot be used for shorting. Shorting defeats the purpose of a DCA bot which has a goal that is Long a position not Short a position. If you want to short, there are plenty of free scripts out there that do this.
You must have some base knowledge or experience with Fibonacci trading, understanding what is ADX, +DI (and -DI), etc.
You can use this script without a 3Commas account and see how 3Commas DCA Bot would perform. However, I highly recommend inexperienced uses get a free account and going through the tutorials, FAQ's and knowledgebase. This would give you a base understanding of the settings you will see in this strategy and why you will need to know them. Only then should you try testing this strategy with a paper bot.
Background
After I had created and released "Fibonacci Zone DCA Strategy", I began expanding and testing other ideas.
The first idea was to add Ranged Volume to the Fibonacci Zone DCA strategy which I wanted for providing further confirmation before entering a trade. The second idea was to add a second Fibonacci Zone that was just as configurable as the first Fibonacci Zone. I managed to add both and they can be easily enabled or disabled via the strategy settings menu.
Things Got Real Interesting
Things got real interesting when I started testing strategies with two Fibonacci zones. Here's a quick list of what I found I was able to do:
Mix and match exit strategies. I could set the Fib-1 zone strategy to exit with a take profit % and separately set the Fib-2 zone strategy to exit when the price crosses the top-high fib border
Trade the trend. A common phrase amongst traders is "the Trend is your friend" and with the help of an additional Fib Zone, I was able to trade the trend more often by using two different Fib Zone strategies which if configured properly can shorten time to re-deploy capital, increase number of closed trades, and in some cases increase net profit.
Trade both bull market uptrends and bear market downtrends in the same strategy. I found I could configure one Fib Zone strategy to be really good in uptrends and another Fib Zone strategy to be really good in downtrends. In some cases, with both Fib Zone strategies enabled together in a single strategy I got better results than if the strategies were backtested separately.
There are many other trade strategies I am finding with this. One could be to trade a convergence or divergence of the two different Fib Zones. This could possibly be achieved by setting one strategy to have different Fibonacci length.
Credits:
Thank you "EvoCrypto" for granting me permission to use "Ranged Volume" to create this strategy
Thank you "eykpunter" for granting me permission to use "Fibonacci Zones" to create this strategy
Thank you "junyou0424" for granting me permission to use "DCA Bot with SuperTrend Emulator" which I used for adding bot inputs, calculations, and strategy

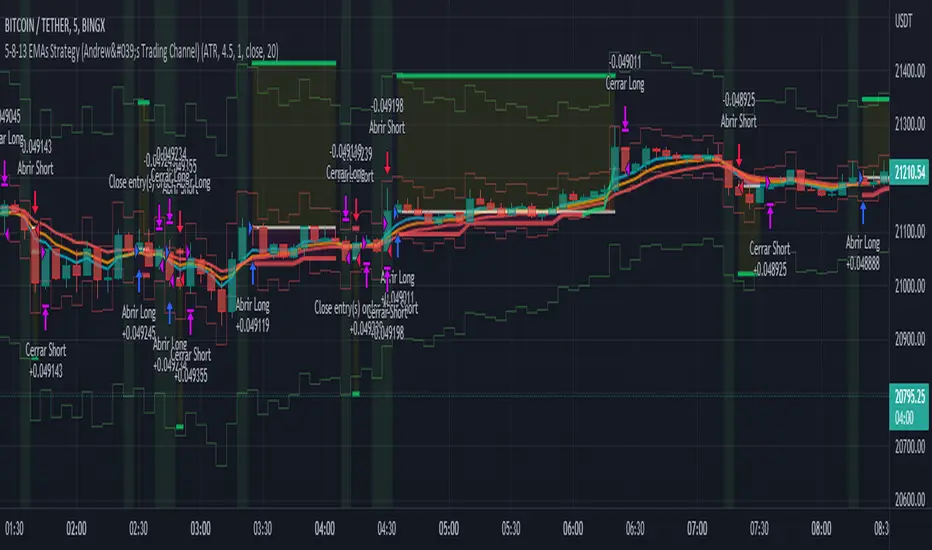
5-8-13 EMAs Strategy (Andrew's Trading Channel)============
ENGLISH
============
- Description:
This strategy was designed by "Andrew's Trading Channel" (credits to him for the base strategy).
A lot of improvements have been added to the strategy, more conditions, trailing stop, custom stop loss and take profit, everything explained below.
- CONDITIONS FOR ENTERING A LONG:
EMA 5 crossovers EMA 8.
- EXIT LONG:
EMA 8 crossovers EMA 8 and closing price goes below EMA 13.
- CONDITIONS FOR ENTERING SHORT:
EMA 8 crossovers EMA 5.
- EXIT SHORT:
EMA 5 crossovers EMA 8 and closing price goes above EMA 13.
- Visual:
All EMAs are visible (5, 8 and 13 periods) with different and customizable colors/width.
Position start price, take profit, stop loss and trailing stop (if present) are shown automatically.
Background color shows green when LONG conditions are met (and of course, position is opened on the next candle), same for SHORT but red.
- Usage and recommendations:
As this is a coded strategy, you don't even have to check for indicators, just open and close trades as the strategy shows.
There're various customizable settings like optional take profit/stop loss, trailing stop (both based on ATR or any of the EMAs), open only LONGs/SHORTs or both, date range...
Take profit and stop loss ATR default values have been tested for scalping on 5 min charts, however feel free to check strategy results and increase the winning rate/profit for your favorite asset.
- Customization:
As usual I like to make as many aspects of my indicators/strategies customizable, indicators, colors etc., feel free to ask if you feel that something that should be configurable is missing or if you have any ideas to optimize the strategy.
============
ESPAÑOL
============
- Descripción:
Esta estrategia fue diseñada por "Andrew's Trading Channel" (créditos a él por la estrategia base).
Se han añadido muchas mejoras a la estrategia, más condiciones, trailing stop, stop loss y take profit personalizados, todo explicado a continuación.
- CONDICIONES PARA ENTRAR EN LONG:
Cruce de EMA 5 con EMA 8 ascendente.
- SALIR DE LONG:
Cruce de EMA 8 con EMA 5 ascendente y el precio de cierre se sitúa por debajo de la EMA 13.
- CONDICIONES PARA ENTRAR EN SHORT:
Cruce de EMA 8 con EMA 5 ascendente.
- SALIR DE SHORT:
Cruce de EMA 5 con EMA 8 ascendente y el precio de cierre se sitúa por encima de la EMA 13.
- Visual:
Todas las EMAs son visibles (5, 8 y 13 períodos) con colores/anchos y personalizables.
El precio de inicio de la posición, el take profit, el stop loss y el trailing stop (si están presentes) se muestran automáticamente.
El color de fondo es verde cuando se cumplen las condiciones de LONG (y por supuesto, la posición se abre en la siguiente vela), lo mismo para SHORT pero en rojo.
- Uso y recomendaciones:
Como esta es una estrategia programada, ni siquiera tienes que comprobar los indicadores, sólo abrir y cerrar las operaciones como te muestra la estrategia.
Hay varios ajustes personalizables como el take profit/stop loss opcional, el trailing stop (ambos basados en el ATR o en cualquiera de las EMAs), abrir sólo LONGs/SHORTs o ambos, rango de fechas...
Los valores por defecto del take profit y el stop loss ATR han sido probados para scalping en gráficos de 5 minutos, sin embargo, siéntase libre de comprobar los resultados de la estrategia y aumentar la tasa de ganancia / beneficio para su activo favorito.
- Personalización:
Como siempre me gusta hacer personalizables todos los aspectos de mis indicadores/estrategias, indicadores, colores, etc., siéntase libre de preguntar si cree que falta algo que debería ser configurable o si tiene alguna idea para optimizar la estrategia.
[Sextan] PINEv5 Sextans Backtest Framework V3.3Level: 5
Background
In order to celebrate the breakthrough of 4000 followers of my account, I decided to release the Sextan backtesting framework for free use to help more quantitative traders quickly evaluate any technical indicators.
The version released this time is based on the algorithm framework optimization of the old version, and integrates the new feature in Pine V5: Bar Magnifier. This new feature to make Sextan strategy backtesting even more accurate. FYI.
www.tradingview.com
Backtesting of technical indicators and strategies is the most common way to understand a quantitative strategy. However, the complicated configuration and adaptation work of backtesting many quantitative tools makes many traders who do not understand the code daunted. Moreover, although I have written a lot of strategies,
However, I am still not very satisfied with the backtest configuration and writing efficiency. Therefore, I have been thinking about how to build a backtesting framework that can quickly and easily evaluate the backtesting performance of any indicator with a "long/short entry" indicator, that is, a "simple backtesting tool for dummies". The performance requirements should be stable, and the operation should be simple and convenient. It is best to "copy", "paste", and "a few mouse clicks" to complete the quick backtest and evaluation of a new indicator.
Luckily, I recently realized that TradingView provides an "Indicator on Indicator" feature, which is the perfect foundation for doing "hot swap" backtesting. My basic idea is to use a two-layer design. The first layer is the technical indicator signal source that needs to be embedded, which is only used to provide buy and sell signals of custom strategies; the second layer is the trading system, which is used to receive the output signals of the first layer, and filter the signals according to the agreed specifications. , Take Profit, Stop Loss, draw buy and sell signals and cost lines, define and send custom buy and sell alert messages to mobile phones, social software or trading interfaces. In general, this two-layer design is a flexible combination of "fixed and flexiable", which can meet the needs of most traders to quickly evaluate the performance of a certain technical indicator. The first layer here is flexible. Users can insert their own strategy codes according to my template, and they can draw buy and sell signals and output them to the second layer. The second layer is fixed, and the overall framework is solidified to ensure the stability and unity of the trading system. It is convenient to compare different or similar strategies under the same conditions. Finally, all trading signals are drawn on the chart, and the output strategy returns. test report.
The main function:
The first layer: "{Sextan} Your Indicator Source", the script provides a template for personalized strategy input, and the signal and definition interfaces ensure full compatibility with the second layer. Backtesting is performed stably in the backtesting framework of the layer. The first layer of this script is also relatively simple: enter your script in the highlighted custom script area, and after ensuring the final buy and sell signals long = bool condition, short = bool condition, the design of the first layer is considered complete. Input it into the PINE script editor of TradingView, save it and add it to the chart, you can see the pulse sequence in yellow (buy) and purple (sell) on the sub-picture, corresponding to the main picture, you can subjectively judge that the quality of the trading point of the strategy is good Bad.
Pine v4 your indicator template:
Pine v5 your indicator template:
Pine v4 your MTF indicator template:
Pine v5 your MTF indicator template:
The second layer: "{Sextan} PINEv4 Sextans Backtest Framework". This script is the standardized trading system strategy execution and alarm, used to generate the final report of the strategy backtest and some key indicators that I have customized that I find useful, such as: winning rate , Odds, Winning Surface, Kelly Ratio, Take Profit and Stop Loss Thresholds, Trading Frequency, etc. are evaluated according to the Kelly formula. To use the second layer, first load it into the TrainingView chart, no markers will appear on the chart, since you have not specified any strategy source signals, click on the gear-shaped setting next to the "{Sextan} PINEv4 Sextans BTFW" header button, you can open the backtest settings, the first item is to select your custom strategy source. Because we have added the strategy source to the chart in the previous step, you can easily find an option "{Sextan} Your Indicator Source: Signal" at the bottom of the list, this is the strategy source input we need, select and confirm , you can see various markers on the main graph, and quickly generate a backtesting profit graph and a list of backtesting reports. You can generate files and download the backtesting reports locally. You can also click the gear on the backtest chart interface to customize some conditions of the backtest, including: initial capital amount, currency type, percentage of each order placed, amount of pyramid additions, commission fees, slippage, etc. configuration. Note: The configuration in the interface dialog overrides the same configuration implemented by the code in the backtest script.
How to output charts:
The first layer: "{Sextan} Your Indicator Source", the output of this script is the pulse value of yellow and purple, yellow +1 means buy, purple -1 means sell.
The second layer: PINEv4 Sextans Backtest Framework". The output of this script is a bit complicated. After all, it is the entire trading system with a lot of information:
1. Blue and red arrows. The blue upward arrow indicates long position, the red downward arrow indicates short position, and the horizontal bar at the end of the purple arrow indicates take profit or stop loss exit.
2. Red and green lines. This is the holding cost line of the strategy, green represents the cost of holding a long position, and red represents the cost of holding a short position. The cost line is a continuous solid line and the price action is relatively close.
3. Green and yellow long take profit and stop loss area and green and yellow long take profit and stop loss fork. Once a long position is held, there is a conditional order for take profit and stop loss. The green horizontal line is the long take profit ratio line, and the yellow is the long stop loss ratio line; the green cross indicates the long take profit price, and the yellow cross indicates the long position. Stop loss price. It's worth noting that the prongs and wires don't necessarily go together. Because of the optimization of the algorithm, for a strong market, the take profit will occur after breaking the take profit line, and the profit will not be taken until the price falls.
4. The purple and red short take profit and stop loss area and the purple red short stop loss fork. Once a short position is held, there will be a take profit and stop loss conditional order, the red is the short take profit ratio line, and the purple is the short stop loss ratio line; the red cross indicates the short take profit price, and the purple cross indicates the short stop loss price.
5. In addition to the above signs, there are also text and numbers indicating the profit and loss values of long and short positions. "L" means long; "S" means short; "XL" means close long; "XS" means close short.
TradingView Strategy Tester Panel:
The overview graph is an intuitive graph that plots the blue (gain) and red (loss) curves of all backtest periods together, and notes: the absolute value and percentage of net profit, the number of all closed positions, the winning percentage, the profit factor, The maximum trading loss, the absolute value and ratio of the average trading profit and loss, and the average number of K-lines held in all trades.
Another is the performance summary. This is to display all long and short statistical indicators of backtesting in the form of a list, such as: net profit, gross profit, Sharpe ratio, maximum position, commission, times of profit and loss, etc.
Finally, the transaction list is a table indexed by the transaction serial number, showing the signal direction, date and time, price, profit and loss, accumulated profit and loss, maximum transaction profit, transaction loss and other values.
Remarks
Free to use but closed source.

Miyagi (VWAP) + DCA BacktestVWAP has been the main condition for entry for our trading community when using the Wick Hunter bot for quite some time now; however using VWAP alone can lead to poor entries and bags.
Miyagi adds filtering conditions which can then be used to improve entries as opposed to simply using VWAP alone.
Miyagi: The attempt at mastering something for the best results.
Miyagi indicators combine multiple trigger conditions and place them in one toolbox for traders to easily use, produce alerts, backtest, reduce risk and increase profitability.
Miyagi (VWAP) + DCA Backtest allows you to backtest your VWAP settings across each pair.
VWAP + Backtest starts with the user selectable take profit and stoploss, both in percent.
Backtesting can be done in any trend direction: Long, Short, or both.
First we start with the VWAP Settings for entry.
The VWAP Settings are based off the original VWAP Indicator found here:
VWAP Timeframe can be adjusted to chart timeframe, or to another timeframe of choice.
VWAP Period is adjustable and should be set to your current period setting.
VWAP Lower Line (Long) is the Percentage Below VWAP = Long Entry.
VWAP Upper Line (Short) is the Percentage Above VWAP = Short Entry.
Once your VWAP Settings are now configured for your current trading settings, you can move onto the DCA and Backtest Settings.
Select DCA to allow and backtest DCA.
Equity %: allows you to select what percent of Equity you will use.
Leverage: Set the leverage you will trade at, from 1-100X.
DCA Start %: This is the percent that your DCA Starts at, in % away from initial entry.
Entry Order Size %: This is the entry order size, in percent of your account, that is used for entry.
DCA Order Size %: This is the DCA order size, in percent of your account, that is used for the first DCA.
DCA Order Size Scale %: This is the DCA size scaling, in %, that is applied to all DCA's after the first.
DCA % from Avg: This is the % away from Average DCA setting.
Step Size Scale %: This is the step size scale setting in percent, that is placed away from your first DCA.
DCA Buy Count: How many DCAs in total that can be used.
Properties Tab includes generic backtest settings including capital amount, base currency, order size, commission, slippage and margin.
Happy Trading!

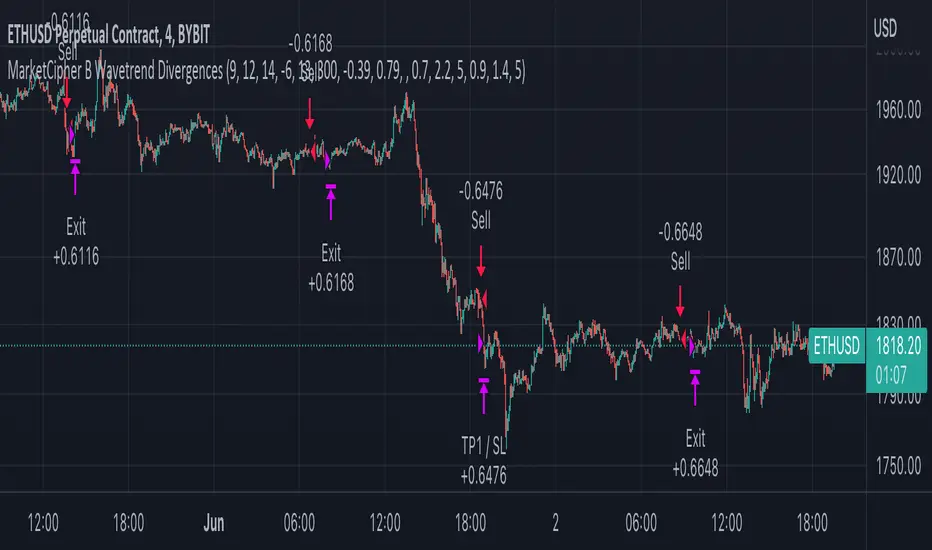
MarketCipher B Wavetrend DivergencesCreated for the MarketCipher Community and friends :)
I have published this before but it was taken down by Tradingview and PineCoders because they wanted a more in depth description so here it is:
This strategy is mainly based on Wavetrend Oscillator by LazyBear / blue momentum waves on MarketCipher B.
The Wavetrend indicator is a combination of 2 oscillator lines that signals the short term direction of the price once the lines cross. The Wavetrend indicator is useful but only once a divergence has been identified based on the crosses and the price which is what this strategy partly uses to open trades.
Here is a list and description of the different conditions that goes into the entries and exits.
Long trade:
1) Bullish divergence, regular or hidden
2) Price is above Exponential Moving Average
3) Chande Momentum Oscillator value is above x
Short trade:
1) Bearish divergence, regular or hidden
2) Price is below Exponential Moving Average
3) Chande Momentum Oscillator value is below x
The Exponential Moving Average (EMA) is a type of moving average that is price based, lagging (or reactive) indicator that displays the average price of a security over a set period of time. The EMA is however different from a normal moving average and values the recent price action. A Moving Average is a good way to confirm trends which is what it is used for in this strategy. If enabled the strategy will only open long trades above the EMA and only short trades below the EMA.
The Chande Momentum Oscillator is a technical momentum indicator and was designed specifically to track the movement and momentum of a security. The oscillator calculates the difference between the sum of both recent gains and recent losses, then dividing the result by the sum of all price movement over the same period. In this strategy it is used like the EMA to filter out bad trades that goes against the trend. The EMA is better at trading the overall trend but the Chande Momentum Oscillator is a lot better at identifying short term market conditions that are favorable for entering at divergences.
One of the most important aspects when creating a trading strategy is to know when to take profit and to make it as dynamic as possible so that it changes to the market conditions. This is what i have tried to do and the reason why this divergence trading strategy works well.
These are the 3 different exit conditions:
1) A dynamic take profit that will signal a short term trend reversal that is based on pivot points and moving averages.
2) Another dynamic take profit based on pivot points that like the previous take profit is used to determine and anticipate potential changes in market price and reversals.
3) A normal % fixed take profit
Photo of what the dynamic take profit looks like on the chart:
The pivot pointexit comes from this indicator that i have helped update and modify from the original script:
When you have found the right settings you can insert the messages from your automatic trading platform at the bottom of the inputs and then create an alert with your unique webhook address along with the alert message below:
{{strategy.order.alert_message}}
I hope this strategy will be useful to automate part of your trading or help you identify and backtest divergences for your manual trading.
Future updates to come.
Enjoy!
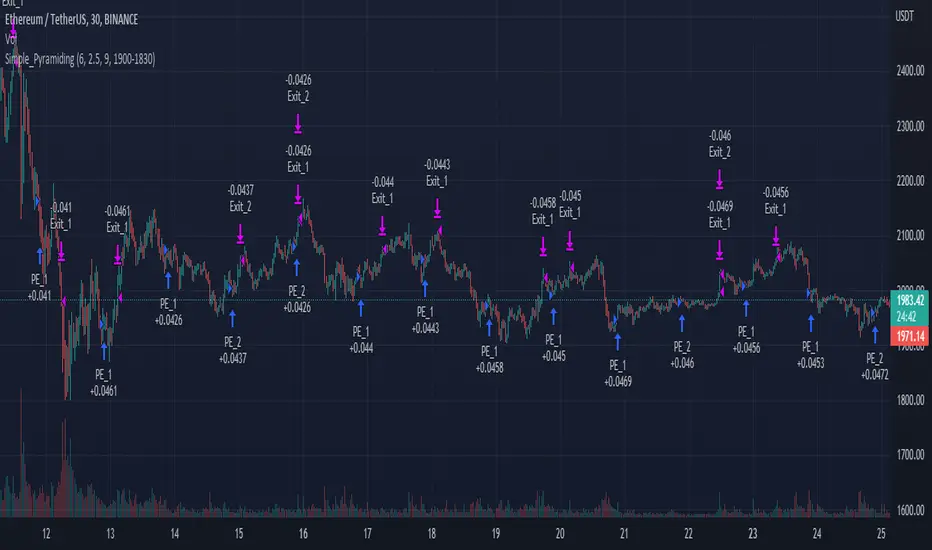
Simple_PyramidingA simple Pyramiding / DCA Strategy. Everyday at a specified time a position is opened. The individual position is closed when a take profit is triggered. Optionally a stop loss can be activated, or the option to close the position at the and of the time frame. You can specify the max amount of open positions. The equity will be divided through the max amount of open positions.
This strategy is a result of an exploration into working with time sessions, pyramiding, for loops and possibilities to trigger individual take profits (profit) and stop loss levels (stop). This strategy is by no means a worked out and reliable strategy. Please feel free to experiment with the code in your indicators and strategies.
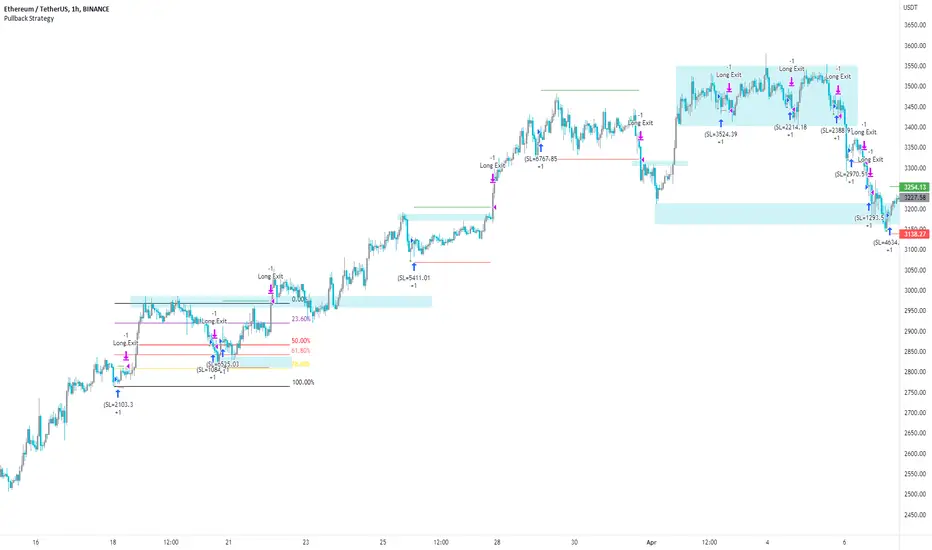
Pullback Strategy (Candle Analysis) New VersionFollowing on from the previous Pullback Candle which smashed over 100 likes - here we have the strategy behind the indicator.
Signal = Pullback Candle (This will alert on all timeframes and markets when selecting the Alert function for the Signal
Entry = When the Pullback Candle is confirmed ie 16:00 - the strategy will enter within the next two candles.
Stop loss = 0.25 ATR multiple which means we have a tighter stop loss - if greater than 1 then the stop loss will be more in percentages!!!
Take Profit = 1.5 Risk to Reward Model
Ema filter - There is a function to modify when looking into trades so as this is a bullish setup we want trades to be over the ema and using this filter will only show trades above the 200ema
Time filter - If you want to backtest Uptrends - locate the time of the start and the end of the uptrend - input this data into the settings and this will bring up the trades in that time period.
Most efficient to use this script is only in uptrends and this signal is a bullish signal - when using a ema filter we wont get trades under this so narrow down good trades for automation.
!!!!TO ENHANCE THE SYSTEM - USE TECHNICAL ANANLYSIS FOR CONFLUENCES
Most inefficient way to use the script is when price is in a downtrend and the win rate falls dramatically.
The pullback candle has a R-Expectancy of R5 so profits can be elongated when trading manually.
As the pullback candle occurs often in a trend we could pyramided trades to say have 5 trades in the same direction but the way i would trade this is to alert R1.5 then look to R2 and above to take profits manually.
(((P.S coders.... i need help to work on a profit extension code where exit long when price is below the 9ema (this seems simple but proving difficult) - this would be included onto the script if received.
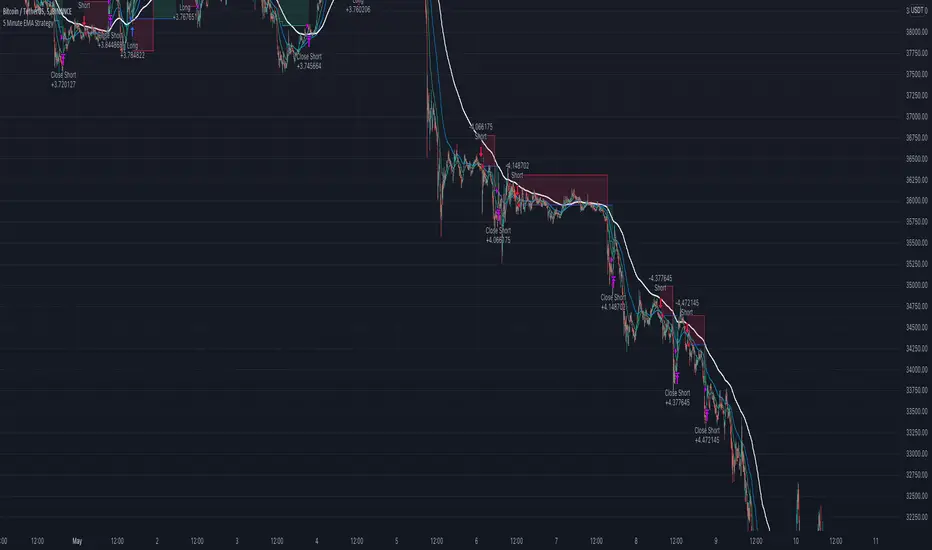
5 Minute EMA Cross StrategyThis simple Fast/Slow EMA cross strategy is designed to be used with Alertatron to place limit orders and use a trailing stop/take profit.
Features:
Indicators when the fast EMA crosses the slow EMA
Trailing Stop/Take Profit
Bar look back for placing limit order
Macro EMA filter to only trade with the macro trend
Big Snapper Alerts R3.0 + Chaiking Volatility condition + TP RSI//@version=5
//
// Bannos
// #NotTradingAdvice #DYOR
// Disclaimer.
// I AM NOT A FINANCIAL ADVISOR.
// THESE IDEAS ARE NOT ADVICE AND ARE FOR EDUCATION PURPOSES ONLY.
// ALWAYS DO YOUR OWN RESEARCH
//
// Author: Adaptation from JustUncleL Big Snapper by Bannos
// Date: May-2022
// Version: R1.0
//Description of this addon - Script using several new conditions to give Long/short and SL levels which was not proposed in the Big Snapper strategy "Big Snapper Alerts R3.0"
//"
//This strategy is based on the use of the Big Snapper outputs from the JustUncleL script and the addition of several conditions to define filtered conditions selecting signal synchrones with a trend and a rise of the volatility.
//Also the strategy proposes to define proportional stop losses and dynamic Take profit using an RSI strategy.
// After delivering the temporary ong/short signal and ploting a green or purple signal, several conditions are defined to consider a Signal is Long or short.
//Let s take the long signal as example(this is the same process with the opposite values for a short).
//step 1 - Long Definition:
// Snapper long signal stored in the buffer variable Longbuffer to say that in a close future, we could have all conditions for a long
// Now we need some conditions to combine with it:
//the second one is to be over the Ma_medium(55)
//and because this is not selective enough, the third one is a Volatility indicator "Chaikin Volatility" indicator giving an indication about the volatility of the price compared to the 10 last values
// -> Using the volatility indicator gives the possibility to increase the potential rise if the volatility is higher compared to the last periods.
//With these 3 signals, we get a robust indication about a potential long signal which is then stored in the variable "Longe"
//Now we have a long signal and can give a long signal with its Stop Loss
// The Long Signal is automatically given as the 3 conditions above are satisfied.
// The Stop loss is a function of the last Candle sizes giving a stop below the 70% of the overall candle which can be assimilated to a Fibonacci level. Below this level it makes sense to stop the trade as the chance to recover the complete Candle is more than 60%
//Now we are in an open Long and can use all the mentioned Stop loss condition but still need a Take Profit condition
//The take profit condition is based on a RSI strategy consisting in taking profit as soon as the RSI come back from the overbought area (which is here defined as a rsi over 70) and reaching the 63.5 level to trigger the Take Profit
//This TP condition is only active when Long is active and when an entry value as been defined.
//Entry and SL level appreas as soon as a Long or short arrow signal does appears. The Take profit will be conidtioned to the RSI.
//The final step in the cycle is a reinitialization of all the values giving the possibility to detect and treat any long new signal coming from the Big Snapper signal.
